Showing posts with label Resources. Show all posts

Wednesday, July 13, 2016

Evaluative Rubrics - Helping you to make sense of your evaluation data

Three times in one week I've now found myself explaining the use of evaluation rubrics to potential evaluation users. I usually start with an example like this, that people can relate to:
When your high school creative writing paper was graded, your teacher most likely gave you an evaluative rubric which specified that you do well if you 1) used good grammar and spelling, 2) structured your arguments well, and 3) found an innovative and interesting angle on your topic. In essence, this rubric helped you to know what is "good" and what is "not good".
In an evaluation, a rubric does exactly the same. What is a good outcome if you judge a post- school science and maths bridging programme? How does the outcomes of "being employed" or  "busy with a third year  B Sc. Degree at university" compare to an outcome like "being a self-employed university drop-out with three registered patents" or to an outcome like "being unemployed and not sure what to do about the future". A rubric can help you to figure this out.

E. Jane Davidson has some excellent resources on rubrics here and here. If you need a rubric on evaluating value for investment, Julian King has a good resource here.  And of course, there is the usual great content on better evaluation here.

I love how Jane describes why we need evaluation rubrics:
Evaluative rubrics make transparent how quality and value are defined and applied. I sometimes refer to rubrics as the antidote to both ‘Rorschach inkblot’ (“You work it out”) and ‘divine judgment’ (“I looked upon it and saw that it was good”)-type evaluations.

Monday, March 04, 2013

How to specify your needs if you require a case study

A client is interested in contracting us to write up a case study for one of their programmes, but they don't really know which information will be necessary. Since there are no terms of reference yet for the case study, I suggested that the client clarifies the following, in order for us to be able to assess the level of effort required.

1. What will the case study be used for? (To document lessons learnt, to help with marketing, to document evidence of a successful initiative)
2. What is the final product that you have in mind, and how long does it need to be? (A written report, or a presentation, or a glossy publication)
3. Who will be reading the Case Study?
4. How much background documents do you have available? (Project descriptions, evaluation findings, participation data, survey data)
5. What kind of additional data collection will be necessary? (Interviews, photo's, site observations)
6. Would you want to meet with the evaluation team before the assignment starts, and after it is completed? 

I came across this useful little guide on how to use Case Studies to do Program Evaluation.It helps one to assess whether a case study should be used, and how to do it.
Edith D. Balbach, Tufts University
March 1999
Copyright © 1999 California Department of Health Services
Developed by the Stanford Center for Research in Disease Prevention
The Better Evaluation page on Case Studies can be found here.

Thursday, February 07, 2013

MOOCs that Evaluators might consider


In a previous post I shared some ideas about Massive Open Online Courses (MOOCs). I came across a listing of free courses offered by some prominent US Universities via online platforms. The full list with more than 200 courses is here:

The site uses the following key to provide information on the certification offered through these courses.
Free Courses Credential Key
CC = Certificate of Completion
SA  = Statement of Accomplishment
CM = Certificate of Mastery
C-VA = Certificate, with Varied Levels of Accomplishment
NI – No Information About Certificate Available
NC = No Certificate

What caught my eye is the fact that there are quite a few courses listed that might be interesting to evaluators looking to improve their stats capacity.

Introduction to Statistics (NI) – UC Berkeley on edX – January 30 (TBD weeks)
Probability and Statistics (NC) – Carnegie Mellon
Statistical Reasoning (NC) – Carnegie Mellon

A few of the courses that started recently that also looks interesting include:

Data Analysis (NI) – Johns Hopkins on Coursera – January 22 (8 weeks)
Introduction to Databases (SA) – Stanford on Class2Go – January 15 (9 weeks)
Introduction to Infographics and Data Visualization (CC) Knight Center at UT-Austin - January 12 (6 weeks)
Social Network Analysis (CC) – University of Michigan on Coursera – January 28 (9 weeks)

Looks like we will have to keep a closer eye on this type of information! 
 

Monday, January 28, 2013

A new start for 2013

I recently took on a long term development project that involves a certain baby with beautiful blue eyes, so the blogging had to move to the back burner. But here is a fresh contribution for this month.


As part of the M&E I do for educational programmes, I frequently suggest to clients that they not only consider the question: “Did the project produce the anticipated gains?” but that they also answer the question “Was the project implemented as planned? This is because sub-optimal implementation is, in my experience, almost always to blame for negative outcomes of the type of initiatives tried out in education. 

Consider the example of a project which aims to roll out extra computer lessons in Maths and Science in order to improve learner test scores in Maths and Science.  We not only do pre-and post-testing of the learner test scores in the participating schools, but we also track how many hours of exposure the kids got, what content they covered, how they reacted to the content, etc. And we attend the project progress meetings where the project implementer reflects on the implementation of the project.  Where we eventually don’t see the kind of learning gains anticipated, we are then able to pinpoint what went “wrong” with the implementation – frequently we can predict what the outcome will be based on what we know from the implementations. This manual on implementation research outlines a more systematic approach to figuring out how best to implement an initiative – written with the health sector in mind.  

Of course implementation success and the final outcomes of the project is only worth investigating for interventions where there is some evidence that the kind of intended changes are possible. If there is no evidence of this kind, we sometimes conduct a field trial with a limited number of kids, on limited content, over a short period of time in an implementation context similar to the one designed for the bigger project.  This helps us to answer the question “Under ideal circumstances, can the initiative make a difference in test scores?

What a client chooses to include in an evaluation is always up to them, but let this be a cautionary tale: A client recently declined to include a monitoring / evaluation component that considered programme fidelity, on the basis that it would make the evaluation too expensive. When we started collecting post-test data for the evaluation, we discovered a huge discrepancy between what happened on the ground, and what was initially planned–  Leaving the donor, the evaluation team and the implementing agency with a situation that has progressed too far to fix easily.  Perhaps if there was better internal monitoring this situation could have been prevented. But involving the evaluators in some monitoring would have definitely helped too!

Thursday, October 06, 2011

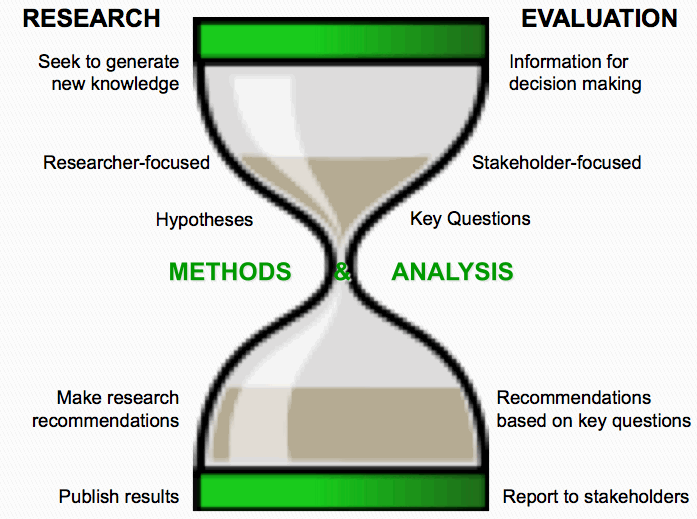
Research vs Evaluation

I found this on AEA 365 and really like the way it explains the difference between research and Evaluation

Tuesday, August 02, 2011

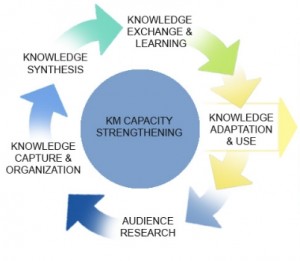
Knowledge Management Toolkit


Knowledge Management for Health put this KM toolkit together that might be useful for Health Practitioners and those in the M&E field who are also concerned with ensuring that the "learning" from our evaluations do not get lost.

It will help those who are:
  • Looking for a primer on KM
  • Developing a KM strategy
  • Interested in knowledge sharing strategies
  • Interested in how to find knowledge and the best ways to organize it
  • Interested in tools to create new insights and knowledge
  • Interested in tools for adapting knowledge to inform and improve policy and program decision-making
  • Evaluating KM activities or programmes

Thursday, July 28, 2011

Information IS (could be) beautiful!

Ooh, ooh! This is so beautiful!  Information is beautiful is David McCandless' blog dedicated to beautifully executed infographics.

Here is an example they picked up from the OECD better life Initiative done by Moritz Stefaner and co.

The length of the "flower petals" indicates the rating of the countries on indicators such as Housing, Income, Jobs, Community, Education, Environment, Governance, Health, Insurance, Life Satisfaction, Safety and Work Life Balance. For information about how they measure these, check out the oecd betterlife website

Thursday, July 21, 2011

SPSS, PASW and PSPP

When IBM acquired SPSS (Statistical Package for the Social Sciences) in 2009, they changed the program's name to PASW (Predictive Analytics SoftWare), but with the next version it became SPSS again. Today I read about PSPP and thought "Oh goodness, did they change the name again?" Turns out that PSPP is an open source verion of SPSS and it allows you to work in a very similar way to SPSS. This is what their website says:

PSPP is a program for statistical analysis of sampled data. It is particularly suited to the analysis and manipulation of very large data sets. In addition to statistical hypothesis tests such as t-tests, analysis of variance and non-parametric tests, PSPP can also perform linear regression and is a very powerful tool for recoding and sorting of data and for calculating metrics such as skewness and kurtosis.PSPP is designed as a Free replacement for SPSS. That is to say, it behaves as experienced SPSS users would expect, and their system files and syntax files can be used in PSPP with little or no modification, and will produce similar results.

PSPP supports numeric variables and string variables up to 32767 bytes long. Variable names may be up to 255 bytes in length. There are no artificial limits on the number of variables or cases. In a few instances, the default behaviour of PSPP differs where the developers believe enhancements are desirable or it makes sense to do so, but this can be overridden by the user if desired.

I will give it a test drive an let you know what I think! 

PS. to all the "pointy-heads": In the right margin of my blog you will find a link to a repository of SPSS sample syntax!

Wednesday, July 20, 2011

Using Graphs in M&E

(The pic above is from Edward Tufte's website - Ive always been a fan of his work on data visualization too!)

One of my colleagues found a really simple yet detailed explanation about uses of graphs. It is written my Joseph Kelly and it is focused on financial data, but still applicable to evaluators who work with quants.


Using Graphs and Visuals
to Present Financial Information

Joseph T. Kelley

This is from the intro:
We will focus on seven widely-available graphs that are easily produced by most any electronic spreadsheet. They are column graphs, bar graphs, line graphs, area graphs, pie graphs, scatter graphs, and combination graphs. Unfortunately there is no consistency in definitions for basic graphs. One writer’s bar graph is another’s column graph, etc. For clarity we will define each as we introduce them. Traditionally we report data in written form, usually by numbers arranged in tables. A properly prepared graph can report data in a visual form. Seeing a picture of data can help managers deal with the problem of too much data and too little information. Whether the need is to inform or to persuade, graphs are an efficient way to communicate because they can
• illustrate trends not obvious in a table
• make conclusions more striking
• insure maximum impact.

Graphs can be a great help not only in the presentation of information but in the analysis of data as well. This article will focus on their use in presentations to the various audiences with which the finance analyst or manager must communicate.

Enjoy!

Wednesday, July 13, 2011

Resource: Reproductive Health Indicators Database


This announcement about a very useful resource came through on SAMEA talk earlier this week.


MEASURE Evaluation Population and Reproductive Health (PRH) project launches new Family Planning/Reproductive Health Indicators Database

The Family Planning/Reproductive Health Database is an updated version of the popular two-volume Compendium of Indicators for Evaluating Reproductive Health Programs (MEASURE Evaluation, 2002).

New features include:
    * a menu of the most widely used indicators for evaluating family planning/reproductive health (FP/RH) programs in developing countries
    * 35 technical areas with over 420 key FP/RH indicators, including definitions, data requirements, data sources, purposes and issues
    * links to more than 120 Web sites and documents containing additional FP/RH indicators    

This comprehensive database aims to increase the monitoring and evaluation capacity, skills and knowledge of those who plan, implement, monitor and evaluate FP/RH programs worldwide. The database is dynamic in nature, allowing indicators and narratives to be revised as research advances and programmatic priorities adapt to changing environments.


Monday, July 11, 2011

South African Consumer Databases

Eighty20 is a neat consultancy that works with various databases available in South Africa to provide businesses, marketers, policy makers and developmental organisations with data-informed insights. I am subscribed to their "fact a day" service, which provides all sorts of interesting statistical trivia, but also exposes the various databases available in South Africa.

Today, their email carried an announcement about a new service called XtracT beta which apparently allows you to "crosstab anything against anything"

They say:
XtracT is the easiest way to access consumer information databases in South Africa. Just choose what interests you (demographics, psychographics, products, media, etc), and a filter if you wish, and a flexible cross-tabulation will appear.
Details about how it works can be found on the XtracT website, and they even have a short tutorial video to explain it.

In case you wondered about their logo... This t-shirt might give you a hint!


Monday, June 20, 2011

How Many Days Does it Take for Respondents to Respond to Your Survey?

At my consultancy we use SurveyMonkey for all our online survey needs. It is simple to use, reliable, and they are very responsive.

Their research and found that

The majority of responses to surveys using an email collector were gathered in the first few days after email invitations were sent, and
•41% of responses were collected within 1 day
•66% of responses were collected within 3 days
•80% of responses were collected within 7 days
 The graph below maps the response rate against time.


The findings suggest that, under most circumstances, it would be best to wait at least seven days before starting to analyze survey responses. Sending out a reminder email after a week would probably boost the response rate somewhat.
SurveyMonkey also did some interesting analysis to answer questions like:

How Much Time are Respondents Willing to Spend on Your Survey?

Does Adding One More Question Impact Survey Completion Rate?

Go check it out!

Thursday, June 09, 2011

The theory behind Sensemaker

Yesterday I posted about Sensemaker. A discussion on the SAMEA listserve ensued. Kevin Kelly  posted this:
 The software (sense maker) is founded on a conceptual framework grounded in the work of Cognitive Edge (David Snowden). The software is very innovative, but not something that one can simply upload and start using. One really needs to grasp the conceptual background first. It should also be noted that the undergirding conceptual framework  (Cynefin) is not specifically oriented to evaluation practice, and is developed more as a set of organisational and information management  practices. I am hoping to run a one-day workshop at the SAMEA conference which looks at the use of complexity and systems concepts, and which will outline the Cynefin framework and explore its relevance and value for M&E.

I think I'll sign up for Kevin's course. I have been reading a little bit about Complexity and evaultion lately.
In case someone else is interested in reading up about specifically cynefin and more general complexity concepts I share some resource (with descriptions from publisher's websites)

  1. Bob Williams and Hummelbrunner (Authors of the book Systems Concepts in Action: A practitioner’s Toolkit ) presented a work session at the November 2010 AEA conference where he introduced some systems tools as it relates to the evaluator’s practice
Systems Concepts in Action: A Practitioner's Toolkit explores the application of systems ideas to investigate, evaluate, and intervene in complex and messy situations. The text serves as a field guide, with each chapter representing a method for describing and analyzing; learning about; or changing and managing a challenge or set of problems. The book is the first to cover in detail such a wide range of methods from so many different parts of the systems field. The book's Introduction gives an overview of systems thinking, its origins, and its major subfields. In addition, the introductory text to each of the book's three parts provides background information on the selected methods. Systems Concepts in Action may serve as a workbook, offering a selection of tools that readers can use immediately. The approaches presented can also be investigated more profoundly, using the recommended readings provided. While these methods are not intended to serve as "recipes," they do serve as a menu of options from which to choose. Readers are invited to combine these instruments in a creative manner in order to assemble a mix that is appropriate for their own strategic needs.

  1. Another good reference about Systems concepts I found was Johnny Morrell’s  Book – Evaluation in the Face of Uncertainty. 
Unexpected events during an evaluation all too often send evaluators into crisis mode. This insightful book provides a systematic framework for diagnosing, anticipating, accommodating, and reining in costs of evaluation surprises. The result is evaluation that is better from a methodological point of view, and more responsive to stakeholders. Jonathan A. Morell identifies the types of surprises that arise at different stages of a program's life cycle and that may affect different aspects of the evaluation, from stakeholder relationships to data quality, methodology, funding, deadlines, information use, and program outcomes. His analysis draws on 18 concise cases from well-known researchers in a variety of evaluation settings. Morell offers guidelines for responding effectively to surprises and for determining the risks and benefits of potential solutions.
His description about the book is here 
 
  1. And then Patton’s latest text (Developmental Evaluation – Applying Complexity Concepts to Enhance Innovation)  also touches on complexity issues and Cynefin  .
Developmental evaluation (DE) offers a powerful approach to monitoring and supporting social innovations by working in partnership with program decision makers. In this book, eminent authority Michael Quinn Patton shows how to conduct evaluations within a DE framework. Patton draws on insights about complex dynamic systems, uncertainty, nonlinearity, and emergence. He illustrates how DE can be used for a range of purposes: ongoing program development, adapting effective principles of practice to local contexts, generating innovations and taking them to scale, and facilitating rapid response in crisis situations. Students and practicing evaluators will appreciate the book's extensive case examples and stories, cartoons, clear writing style, "closer look" sidebars, and summary tables. Provided is essential guidance for making evaluations useful, practical, and credible in support of social change.

  1. Rogers also published a nice article in 2008 in the Journal Evaluation about this 
 This article proposes ways to use programme theory for evaluating aspects of programmes that are complicated or complex. It argues that there are useful distinctions to be drawn between aspects that are complicated and those that are complex, and provides examples of programme theory evaluations that have usefully represented and address both of these. While complexity has been defined in varied ways in previous discussions of evaluation theory and practice, this article draws on Glouberman and Zimmerman's conceptualization of the differences between what is complicated (multiple components) and what is complex (emergent). Complicated programme theory may be used to represent interventions with multiple components, multiple agencies, multiple simultaneous causal strands and/or multiple alternative causal strands. Complex programme theory may be used to represent recursive causality (with reinforcing loops), disproportionate relationships (where at critical levels, a small change can make a big difference — a `tipping point') and emergent outcomes. 

For more resources, try AEA 365