Tuesday, December 05, 2006

Log Frame Training - Common Challenges

I recently again facilitated a logframe workshop where I oriented the managers of intervention programmes towards basic log frame concepts and the idea of indicators, targets and means of verification.

Most people seem to intuitively grasp what we are trying to achieve when we present the workshop, and most take well to the assumption that it allows for better planning, monitoring and evaluation, but a set of common challenges seem to arise. In this entry I highlight three of these challenges and give an idea of how I try to get around them. I would be interested to hear from anyone how they approach these.

CHALLENGE 1:
Participants find it difficult to distinguish outputs, outcomes and impacts from one another. Even if we give them plenty of examples, clear definitions and an opportunity to practice their identification of the different kinds of results, they still find it difficult to correctly place these in the results chain. It is not absolutely crucial that they are placed correctly, but it definitely helps when you are later developing and indicators matrix. To help participants, I often give the following explanation
  • Outputs are what your programme delivers and are often a tangible indication that some activity was completed.
  • Outcomes are the changes you hope to see in the behaviour / skill / knowledge / values / attitudes of those you interact with in the shorter term.
  • Impacts are the other organisational and longer term changes you hope to see as a result of changed behaviour / skills / knowledge / values / attitudes of the participants.

And then I demonstrate it with a tomato plant example:

  • Planting tomato seeds, fertilising them and watering the soil are likely to result in a number of green sprouts emerging as a direct result of your "intervention". These aren't yet the tomatoes, but they tell you that you that some activity was completed and that you are possibly on your way to some sort of meaningful result (Output).
  • Having big fat red juicy tomatoes harvested tells you that you have achieved something - the seeds changed into something more useful (Outcome).
  • If you are able to eat your tomatoes and enhance your nutrition or if you sell the tomatoes to supplement your income, these are impact level results (Impact).

CHALLENGE 2:

When participants do a problem analysis they tend to accurately identify the level of intervention required to actually solve a problem. But when it comes to planning the intervention, they loose sight of the magnitude of the problem (despite being encouraged to go back to the problem analysis) and rather focus on the practicalities as it relates to their current organisational strength. So they agree to do two three hour workshops per term because that is all that they can manage. I often have to point them to the example again to get them to understand the effect of this kind of programming:

In the tomato plant example this equates to agreeing to water the tomatoes only once a month because that is all you have the time and staff for. And it obviously could lead to a reduction in the benefits gained.

CHALLENGE 3:

When developing a Log Frame Indicators Matrix, people have great difficulty in ensuring that the indicator , target and means of verification align well.

  • They might talk about the number of something in the indicator and put a percentage in the target. E.g. Indicator: The number of indicators that complete the course. Target: 90% of all Educators
  • They might talk about an increase in performance when they phrase the indicators, but only refer to a single measurement opportunity in the means of verification without any baseline data available. E.g. Indicator: Increase in learner performance on literacy test. Target: 80% of learners must pass. Means of Verification: End of year test

I have used the the following "recipe" with some success.

Appropriate targets if your indicator says something about an
INCREASE / IMPROVEMENT IN
–Number of people with skill / knowledge / appropriate behaviour
*e.g. 20% more people ….
–The knowledge / skill / quality level at which your participants can do something
*e.g. Average knowledge score increases with x%
- The number of people achieving a certain standard increases (e.x. pass, expemption)

* e.g. Number of persons passing increases with 20% over baseline

NOTE If you speak about an increase / improvement in your indicator / target your means of verification presupposes that knowledge about the baseline conditions and at least one other period in time will be required.

Appropriate targets if your indicator says something about achieving a
MINIMUM STANDARD
–Number of people achieving the minimum standard

*e.g. 80% of people must at least pass / get 80%
NOTE: This could be measured at a single instance only

Appropriate targets if your indicator says something about establishing SOMETHING NEW

–Number of people doing / showing something new

* e.g. 125 people must submit a business plan to COMSA
–The frequency with which people do something new

*e.g. Teachers to include open-ended questioning at least once in all observed lessons

Note: This could be measured at a single instance only.

Wednesday, October 18, 2006

My Impressions: UKES / EES Conference 2006

The first joint UKES (United Kingdom Evaluation Society) and EES (European Evaluation Society) evaluation conference was held at the beginning of October in London. It was attended by approximately 550 participants from over 50 countries – Also a number of the prominent thinkers in M&E from North America. Approximately 15 South Africans attended the conference and approximately 300 papers were presented in the 6 streams of the conference. The official conference website is at: http://www.profbriefings.co.uk/EISCC2006/

Although it is impossible to summarise even a representative selection of what was said at the conference, I was struck by particularly discussions around the following:

How North-South and West-East evaluation relationships can be improved.
A panel discussion was held on this topic where a representative from the UKES, IOCE (International Organisation for Cooperation in Evaluation), and IDEAS (International Development Evaluation Association) gave some input followed by a vigorous discussion about what should be done to improve relationships. The international organizations used this as an opportunity to find out what could be done in terms of capacity building, advocacy, sharing of experiences and representation in major evaluation dialogues (e.g. the Paris declaration on Aid effectiveness[1]) etc. Like the South African Association, these associations also run on the resources made available by volunteers so the scope of activities that can be started is limited. The need for finding high-yield, quick gains was explored.
Filling the empty chairs around the evaluation table
Elliott Stern (Past president of UKES / EES and Editor of “Evaluation”) made the point that many of the evaluations done are not done by people that typically identify with the identity of an evaluator - Think specifically of Economists. Not having them represented when we talk about evaluation and how it should be improved means that they miss out on the current dialogue, and we don’t get an opportunity to learn from their perspectives.


Importance of developing a programme theory regarding evaluations
When we evaluate programmes and policies we recognize that clarifying the programme theory can help to clarify what exactly we expect to happen. One of the biggest challenges in the evaluation field is making sure that evaluations are used in the decision-making processes. Developing a programme theory regarding evaluations can help us to clarify what the actions are that’s required to ensure that change happens after the evaluation is completed. When we think of evaluation in this way, it is emphasized once again that delivering and presenting a report only cannot reasonably be expected to impact the way in which a programme is implemented. More research is required to establish exactly under which conditions a set of specific activities will lead to evaluation use.


Research about Evaluation is required so that we can have better theories on Evaluation
Steward Donaldson & Christina Christie (Claremont Graduate University) and a couple of other speakers were quite adamant that if “Evaluation” wants to be taken seriously as a field, we need more research to develop theories that go beyond only telling us how to do evaluations. Internationally evaluation is being recognized as a Meta-Discipline and a Profession, but as a field of science we really don’t have a lot of research about evaluation. Our theories are more likely to tell us how to do evaluations and what tool sets to use, but we have very little objective evidence that one way of doing evaluations is better or produce better results than another.


Theory of Evaluation might develop in some interesting ways
There was also talk about some likely future advances in evaluation theory. Melvin Mark (Current AEA President) said that looking for one comprehensive theory of evaluation is probably not going to deliver results. Different theories are useful under different circumstance. What we should aim for are more contingency theories that tell us when to do what. Current examples of contingency theories include Patton’s Utilization Focused Evaluation Approach - The intended use by intended users determines what kind of evaluation will be done. Theories that take into account the phase of implementation is also critically important. More theories on specific content areas are likely to be very useful e.g. evaluation influence, stakeholder engagement etc. Bill Trochim (President-Elect of AEA) presented a paper on Evolutionary Evaluation that was quite thought provoking and continued from thinking of Donald Campbell etc.

Evaluation for Accountability
Baronness Onora O’Neill (President of the British Academy) expanded what accountability through evaluation means by expanding on the question “Who should be held accountable and by whom?” She indicated that evaluation is but one of a range of activities that’s required to keep governments and their agencies accountable, yet a very critical one. The issue of evaluation for accountability was also echoed by other speakers like Sulley Gariba (From Ghana, previous president of IDEAS) with vivid descriptions of how the African Peer Review Mechanism could be seen as one such type of evaluation that delivers results when communicated to the critical audience.


Evidence Based Policy Making / Programming
Since the European Commission an the OECD was well represented, many of the presentations focused on / touched on topics relating to evidence based policy making. The DAC principles of Evaluation for development assistance (namely Relevance, Effectiveness, Efficiency, Impact, Sustainability) seems to be quite entrenched in evaluation systems, but innovative and useful ways of measuring impact level results was explored by quite some speakers.

Interesting Resources
Some interesting resources that I learned of during the conference include:
www.evalsed.com An online resource of the European Union for the evaluation of Socio-economic development.
The SAGE Handbook of Evaluation Edited by Ian Shaw, Jennifer Green, and Melvin Mark. More information at: http://www.sagepub.com/booksProdDesc.nav?prodId=Book217583
Encyclopedia for Evaluation edited by Sandra Mathisson. More info at: http://www.sagepub.com/booksProdDesc.nav?prodId=Book220777 Other Guidelines for good practice: http://www.evaluation.org.uk/Pub_library/Good_Practice.htm
[1] For more info about the Paris Declaration look at http://www.oecd.org/document/18/0,2340,en_2649_3236398_35401554_1_1_1_1,00.html

Social Entrepreneurship

I’ve got a bee in my bonnet. And I must admit, I don’t quite know what to do with it. It probably has something to do with all of those systems-theory lectures I had at university. Here it is: We know the world and what happens in it cannot necessarily be explained in a linear fashion. So why, oh why do we plan and evaluate ALL our projects according to the logic model (where the combination of A, B and C under conditions D and E will produce F, G and H)? – then again… maybe it is just me and other people (Maybe I should Ask Bob Williams… he’s a real systems guy!) already have very nicely functioning alternative toolsets and methods to evaluate the non-linear world. (If you happen to be one of them, please come and save me from my ignorance and leave a comment so that I can learn from you)

I’m not proposing that we throw out that approach totally. But really! Given the scope of the developmental challenges we have here in SA, we must really hope for a miracle if we think that our logically planned out projects are going to solve all of our problems. If we have a little faith in the fact that we live in a chaotic system that has the capacity for self-organisation, we might actually want to start planning our interventions in a way that empowers key agents in the system to go out and do a number of unexpected and hopefully amazing things.

A related question: Why do we ONLY fund and evaluate projects and organizations, when it is people that make the difference? Let me clarify, I’m not saying projects and organizations don’t make a difference… But it is the 79 year old lady that decides to do something for the kids of her community on one special day. It is the social worker who thinks of a way to take the extra food off our tables and find a way to distribute it to those who need it… It is the guy who drives past the men on the side of the road that suddenly thinks of a way to provide tools and job opportunities to them.

These special people – “Social Entrepreneurs” I think they are called - Should be funded to do what they do best – think of ideas, implement them and set up structures. Because lo and behold they start worrying about how to put dinner on the table and abandon their potentially brilliant idea to take a desk job somewhere! This is apparently exactly what Ashoka does. See their website for more information: http://www.ashoka.org/africa

When venture capital investors want to invest in a new and innovative idea the majority of their pre-assessment work is around the individual that is pitching the idea. Some people just have the diversity of networks, skills and resources at their disposal to make things happen. Maybe there is some lesson in this for us!

Monday, October 16, 2006

Common Pitfalls in M&E

This is an outline for a presentation I recently deliverd.

Common Pitfalls in Monitoring and Evaluation
Issues to Consider when you are the implementer / commissioner of evaluations

Introduction: What people Think of Evaluations
Often people are very scared of evaluations because of previous experiences, lack of experience or a general misconception regarding evaluations.

Introduction: Why must we measure?
Although there is growing consensus that we need to measure the results (outputs, outcomes and impacts) of our projects / programmes / policies, there is still much confusion about exactly why we are doing it.
Two main purposes of evaluations:
-- Accountability to various stakeholders
--Learning to improve the projects / programmes / policies
The projects / progammes / policies we implement affect thousands of people and if we get it wrong thousands will be affected negatively (or not affected at all)
We often complain about the cost of measuring our impact, but have we considered the costs of not measuring our impact?


Introduction: We want to evaluate BUT…
Once we are convinced that we should be measuring our impacts, a range of other questions come up:
--How should it be evaluated?
--When should it be evaluated?
--How will we know that the impact is the best possible?
--How do we know if it is our programme that made those differences?
--Can we do our own evaluation or should we get some specialist to do it?
--If there were simple one-size fits all answers to these questions, evaluation would probably have been much more appealing than it is today.

Common Pitfalls in Evaluation 1
Failing to clarify the intended use or the intended users of the evaluation – Producing "Door Stops".
Thinking you can evaluate your impact after year one of an intervention in a complex system – Expecting too much.
Thinking your impact evaluation is only something you need to worry about at the end of the project – Waiting too long.
Measuring every detail of a programme thinking that it will allow you to get to the big picture "impact" – Measuring too much.
Doing the wrong type of evaluation for the phase in which the project is in – Method / timing match.


Common Pitfalls in Evaluation 2
Allocating too little time and resources to the evaluation – More is better.
Allocating too much time and resources to the evaluation - Less is more.
Sticking to your or someone else’s "template" only – One size does not fit all.
Thinking that an online M&E system will solve all of your problems – Computers don’t solve everything.
Not planning for how the evaluation findings will be used – Findings don’t speak for themselves.

Common Pitfalls in Evaluation 3
Running a lottery when you are supposed to receive tenders for doing the evaluation – Lottery evaluations
Sending the evaluation team in to open Pandora’s box – Don’t do evaluation if you need Organisational Development.
Doing an impact evaluation without taking into consideration the possible influence of other initiatives / factors in the environment – Attribution Error.
Doing an impact evaluation without looking what the unintended consequences of the project was – Tunnel Vision
Ignoring the voices of the "evaluated" – Disempowering people

Common Pitfalls in Evaluation 4
Expecting your content specialist to also be an evaluation specialist and vice-versa – Pseudo Specialists lead to pseudo knowledge
Doing evaluations, creating expectations and then ignoring the results
Do not report statistics like level of significance and effect size when you incorporate a quantitative aspect to your evaluation – Being afraid of the "hard stuff"
Do not acknowledge the lenses you are using to analyse your qualitative data – Being colour blind
Getting hung up on the debate about whether quantitative / qualitative methods are better – Method Madness

How to address the pitfalls
Given that until very recently there were no academic programmes focusing on training people in evaluation, it is important that we find ways of improving our understanding of the field.
You need not be an evaluation specialist to be involved with evaluation.
Make sure that the evaluators you work with have development as an ultimate goal.


How to address the pitfalls
Resources for helping you to do / commission better evaluations
Join an association: For example the South African Monitoring and Evaluation Association (http://www.samea.org.za/) or the African Evaluation Association (http://www.afrea.org/)
Take cognisance of the guidelines and standards produced by these organisations
Make use of the many online resources available on the topic of evaluation (Check out Resources on the SAMEA web page)

Monday, September 04, 2006

When it really doesn’t make sense to use euphemisms

The following call for submissions was recently circulated in the M&E community.

“ORGANISATION ABC wants to engage in contracts with representative independent individual contactors in all provinces. We are therefore inviting representative individuals who are well qualified and experienced in Monitoring and Evaluation and related areas to submit their curriculum vitae’s and relevant information for consideration and possible invitation to attend a selection interview and deliver a simulated presentation.”

What is all of this talk about “representative individuals” about? I wonder why they just couldn’t come out and say “Individuals from Historically Disadvantaged Groups”. Strictly speaking, as a white female I am surely representative of some demographic in South Africa, ‘though I don’t think I am exactly what they mean under “representative individual!

And on an entirely non-M&E note, I read the following poem from Antjie Krog in "Verweerskrif" published by Umuzi in 2006 (Also available in English as "Body Bereft". Seems like we won’t get away from representing something ‘till the day death comes knocking.

namens myself

namens niemand hoef ek iets meer te benader nie
namens niemand hoef ek meer verantwoording
te doen of om vergifnis te vra nie.

niemand se gemarginaliseerde perspektief
hoef ek meer op tafel te plaas
of my in ander se vel te verbeel nie

die eerste voorhoedes van die dood
het opgedaag en die liggaam gly soos sand
deur die vingers. apatie neutraliseer die sintuie

oorlewing ontplooi soos ‘n woestaard en sny
jou af van ander sodat jy al meer vertroud
raak met die na-binne-gedraaidheid van die dood

Laai vir laai word jy leeggemaak
Tot net nog die leƫ binnekant jou raak

Wednesday, August 23, 2006

Why do we Use Logic Models?

We often use logic models when we do evaluations, and I must admit, I don't often wonder why I do it. The value is just implicit to me. On the AEA listserv, Sharon Stout put a summary together of what logic models are good for, and I agree with all of this. She writes:

“Below is my synopsis of Jonathan Morell's synopsis (plus later additions by Patricia Rogers) with additional text taken from a post of Doug Fraser's thrown in with a short bit credited earlier to Joseph Wholey.
See below ...

The logic model serves four key purposes:

-- Exploring what is valued (values clarification) – e.g., as in building consensus in developing a logic model, how elements interact in theory, and how this program compares;

-- Providing a conceptual tool to aid in designing an evaluation, research project, or experiment to use in supporting -- to the extent possible – or falsifying a hypothesized causal chain;

-- Describing what is, making gaps between what was supposed to happen and what actually happened more obvious, and more likely to be observed, measured, or investigated in future research or programming; and

-- Finally, developing a logic model may make evaluation unnecessary, as sometimes the logic model shows that the program is so ill-conceived that more work needs to be done before the program can be implemented – or if implemented, before the program is evaluated.”


Michael Scriven then took the discussion further, and again I absolutely agree with everything he says:

“Good job collecting the arguments for logic models together. Of course, they do look pretty pathetic when stripped down a bit--to the sceptical eye, at least. It might not be a bad idea to gather some alternative views of ways to achieve the claimed payoffs, if you’re after an overview. Here’s a overcompressed effort:

“Key purposes of logic models," as you've extracted them from the extended discussion:
1. Values clarification. Alternative approach: identify assumed or quoted values, and clarify them as values, mainly by identifying the standards on their dimensions that you will need in order to generate evaluative conclusions; a considerably more direct procedure.

2. An aid in designing the evaluation. Alternative approach: Do it as you would do it for a black box, since you need to have that skill anyway, and it’s simpler and less likely to get you offtrack (i.e., look for how the impact and process of the program score on the scales you have worked up for needs and other values)

3. Describing what ‘is’. The program theory isn’t part of what is, so do the program description directly and avoid getting emroiled in theory fights.

4. Possibly avoid doing the evaluation. None of your business whether they’re great thinkers; they have a pgrm, they want it evaluated, OK do your job.

Then there’s other relevant considerations like:

5. Reasons for NOT working out the logic model.
Reason A: you don’t need it, see 1 above.
Reason B: your job is evaluating not explaining, so you shouldn’t be doing it.
Reason C: doing it takes a lot of time and money in many cases, so it often cuts down on the time on doing the real evaluation, so if you budgeted that time, you’ll get underbid, and if you didn’t, you’ll go broke.
Reason D: in many cases, the logic model doesn’t make sense but the program works, so what’s the payoff from finding that the model is no good or improving--payofff meaning payoff for the application field that wants something that works and doesn’t care whether it’s based on the power of prayer, the invocation of demons, good science, or simple witchcraft.(NOW THIS HAD ME IN STITCHES!) Think about helping the people first, adding to science later, on a different contract.

In general, the obsession with logic models is running a serious risk of bringing bad reputations to evaluators, and to evaluation, since evaluators are not expert program designers and not the top experts in the subject matter field that are often the only ones that can produce better programs. You want to be a field guru, get a PhD and some other creds in the field and be a field guru; you want to find out if the field gurus can produce a program that works, be an evaluator. Just don’t get lost in the woods because you can’t get the two jobs distinguished (and try not to lure too many other innocents with you into the forest).

Olive branches:
(i) of course, the logic theory approach doesn’t always fail, it's just (mostly) a way of wasting time that sometimes produces a good idea, like doodling or concept mapping (when used out of place);
(ii) of course, it makes sense to listen to the logic theory of the client, since that's part of getting a grip on the context, and asking questions when you hear it may turn up some problems they should sort out. Fine, a bonus service from you. Just don't take fixing the logic model as one of your duties. After all:
(iii) Some of the most valuable additions to science come about from practices like primitive herbal medicine (eg the use of quinine, aspirin, curare) or the power of faith (hypnosis, faith-healing) that work although there's no good theory why they work; finding more of those is probably the best way that evaluators can contribute to science. If you require a good theory before you look at whether the program works, you'll never find these gold mines. So, though it may sound preachy, I think your first duty is to evaluate the program, even if your scientific training or recreational interests incline you to try for explanations first.

My conclusion is that next time, before I go about writing up a logic model “just because it is the way we do evaluations” I’ll be a little bit more critical and consider whether this isn’t an instance where I should not have to get a logic model.

Thursday, August 17, 2006

Cultural Competence of Evaluators

Hazel Symonette from the University of Wisconsin recently visited South Africa and presented M&E workshops in collaboration with the South African Monitoring and Evaluation Association. Unfortunately my diary did not allow me to attend any of the workshops, but I was lucky enough to have some interaction with her on an informal basis. This made me think about cultural competence required by evaluators. Look, we are long past the positivistic view where an evaluator was believed to be the expert able to look at behaviour and responses of people and categorise it objectively. What Hazel’s visit reinforced for me was the fact that cultural competence and identifying the lenses through which we look is extremely important if we want to do a good job as an evaluator.

This morning I read an article in the paper about learners in Mpumalanga schools:

'Teachers are bewitching us' 2006-08-16 19:07:56 http://www.mweb.co.za/news/?p=top_article&i=224129

There appears to be a growing tendency among Mpumalanga school pupils to accuse their teachers of witchcraft and then start a riot or boycott class. Nelspruit - There's a growing tendency among Mpumalanga school pupils to accuse their teachers of witchcraft and then start a riot or boycott class. Pupils at four schools have rioted in separate incidents since March, said provincial education spokesperson Hlahla Ngwenya on Wednesday. The latest incident happened on Monday when pupils at Mambane secondary school in Nkomazi, south of Malelane, refused to attend classes after allegations that teachers were bewitching them. The pupils returned to class on Tuesday. "Our preliminary reports indicate that the pupils protested after some of their peers died in succession over a short period," said Ngwenya. "They seem to believe this was the doing of their teachers." He said the department was investigating the incident and that pupils found guilty of instigating the boycott faced expulsion.


Imagine I was an evaluator in that community, working with the schools on the evaluation of some whole school development initiative. From my Westernised perspective witchcraft is just silly, and people believing in witchcraft are obviously mistaking one issue for another. Do I have the competence to be the evaluator in such a situation? How valid would my conclusions have been if I was in that situation?

I would probably have searched for alternative explanations, or more culturally acceptable explanations – I.e. There is obviously a problem in the relationship between the educators and the learners. It also seems that there are a range of very unfortunate circumstances (possibly a problem with HIV/AIDS?) in that community that needs attention. Just because I don’t accept their explanation and choose to come up with other explanations that are more culturally acceptable in my frame of reference (and probably in the frame of reference from which the programme donors come), does that mean it is the correct answer? Isn’t there maybe something beyond my perspective?

In my time as an evaluator I have come across a couple of other similarly absurd sets of behaviours – Teachers that toyi-toyi about catering whilst being on a government sponsored training session. Project beneficiaries refusing to disclose their names during interviews about an NGO’s performance. Clients being scared of saying anything out of fear that they might experience negative circumstances. Maybe these “absurdities”, when I recognize them, is a cue that I am out of my league?

Wednesday, August 02, 2006

Public Sector Accountability and Performance Measurement

"I have been working now for about 20 years in the area of evaluation and performance measurement, and I am so discouraged about performance measurment and results reporting and its supposed impact on accountability that I am just about ready to throw in the towel. So I have had to go right back to the basics of reporting and democracy to try to trace a line from what was intended to what we have ended up with." (Karen Hicks on 28 July 06 on the AEA Evaltalk listserv).

This made me think - In our government, at least in the departments I work with, this is also quite a prominent issue. We do so much reporting and performance measurement, but does it help us to be more accountable? Why do we do all of this reporting, and who do we do the reporting to?

A national departments' strategic planning and performance reporting manual explains what the intention is with the government M&E:

"Every five years the citizens of South Africa vote in national and provincial elections in order to choose the political party they want to govern the country or the province for the next five years. In essence the voters give the winning political party a mandate to implement over the next five years the policies and plans it spelt out in its election manifesto.
Following such elections the majority party (or majority coalition) in the National Assembly elects a President, who then selects a new Cabinet. The President and the Cabinet have the responsibility (mandate) of implementing the majority party’s election manifesto nationally. While at the provincial sphere, the majority party (or majority coalition) in each provincial legislature elects a Premier, who selects a new Executive Committee. The Premier and the Executive Committee have the responsibility (mandate) of implementing the majority party’s election manifesto within the province".

The governing party's election manifesto gets translated into policy and plans, and particularly the strategic plans and annual performance plans are key in this regard. The strategic plans spell out, for a five year period, what the department's goals, objectives and priorities will be. Since there has been quite an infusion of the idea that "what gets measured, gets managed" in South African Government, Government Departments are also encouraged to set Mesurable Objectives and Performance Indicators relating to all of the goals and objectives in the strategic plan. These Measurable Objectives and Indicators are then used to reflect on an annual basis on the performance of a Department.

A common problem with this approach is that Departments want to set indicators that measure the outcome of all the Departments' activities at activity level, rather than at programme level. This leads to the unfortunate result of a million and ten indicators that are too unwieldy to communicate and analyse effectively. Other common problems also include misalignment between the indicators and the objective it is supposed to measure, and some objectives just do not have any measurable objectives because the data that is available does not allow for efective measurement.

Besides all of these difficulties, though, the biggest drawback of this type of reporting for accountability is that it comes down to government reflecting on its own performance against governments' plans. For the sake of democracy it is important that reporting should go beyond this and place information in the hands of the public that would allow them to not only critically reflect on government's success in implementing its plans, but also critically reflect on the appropriateness of the plans and the prioritisation of objectives in the first place.

South Africa has come up with some sort of solution to this challenge by instituting the Public Services Commission with the mandate to evaluate the public service on an annual basis against nine constitutionally enshrined principles. The result of this evaluation is the PSC report entitled: State of the Public Service Report which is published annually. The 2006 report is available at:
http://www.psc.gov.za/docs/reports/2006/designed%20report%20220506.pdf

Wednesday, July 26, 2006

Google Scholar

This is such a good idea, I wonder why they didn't come up with it a long time ago.
Google has a new search engine for searching academic literature online.
www.scholar.google.com

Doing a search for "Well Being" on Google Scholar, returned 61,600 results. The top results returned include:

Psychological Well-Being in Adult Life.CD Ryff - Current Directions in Psychological Science, 1995 - Blackwell Synergy ... Being (Aldine, Chicago, 1969); E. Diener, Subjective well-being, Psychological Bulletin,95, 542-575 (1984); MP Lawton, The varities of wellbeing, in Emotion ... Cited by 81 - Web Search
[CITATION] Scales for the measurement of some work attitudes and aspects of psychological well-beingP Warr, J Cook, T Wall - Journal of Occupational Psychology, 1979
Cited by 235 - Web Search
[CITATION] Relation of agency and communion to well-being: Evidence and potential explanationsVS Helgeson - Psychological Bulletin, 1994
Cited by 116 - Web Search - BL Direct
[CITATION] The measurement of well-being and other aspects of mental healthP Warr - Journal of Occupational Psychology, 1990
Cited by 102 - Web Search
… patient centred care of diabetes in general practice: impact on current wellbeing and future disease … - group of 6 »AL Kinmonth, A Woodcock, S Griffin, N Spiegal, MJ … - British Medical Journal - bmj.bmjjournals.com ... General Practice. Randomised controlled trial of patient centred care of diabetesin general practice: impact on current wellbeing and future disease risk. ... Cited by 117 - Web Search - BL Direct
Factors affecting the emotional wellbeing of the caregivers of dementia sufferers - group of 3 »RG Morris - The British Journal of Psychiatry, 1988 - bjp.rcpsych.org ... Royal College of Psychiatrists. Factors affecting the emotional wellbeing ofthe caregivers of dementia sufferers. RG Morris, LW Morris ... Cited by 67 - Web Search
Sports participation and emotional wellbeing in adolescents. - group of 2 »A Steptoe, N Butler - Lancet, 1996 - ncbi.nlm.nih.gov ... Sports participation and emotional wellbeing in adolescents. Steptoe A,Butler N. Department of Psychology, St George's Hospital ... Cited by 55 - Web Search - BL

Doing the same search on the normal google delivers 23,000,000 hits with the following under the top ranked items:

Well Being
WellBeing of Women is the only national charity funding vital research into all aspects of women's reproductive health.www.wellbeingofwomen.org.uk/ - 18k -
Cached - Similar pages
WellBeing
WellBeing.com.au Australia - natural health directory, courses and seminars, natural health articles and more. Yoga, Acupuncture, Bowen Therapy, ...www.wellbeing.com.au/ - 43k -
Cached - Similar pages
A manifesto for wellbeing
We often think of wellbeing as happiness, but it is more than that. ... But for most Australians more money would add little to their wellbeing. ...www.wellbeingmanifesto.net/ - 20k -
Cached - Similar pages
Mental Health and Wellbeing
Information on Australian Government mental health and wellbeing and suicide prevention initiatives, including beyondblue – the National Depression ...health.gov.au/internet/wcms/publishing.nsf/Content/Mental+Health+and+Wellbeing-1 - 17k -
Cached - Similar pages
Well Being Journal
Well Being Journal: a health and wellness journal covering alternative medicine, natural healing, nutrition, herbs, and spiritual medicine.www.wellbeingjournal.com/ - 9k -
Cached - Similar pages
Australian Centre on Quality of Life - The Australian Unity Index ...
The AustralianUnity Wellbeing Index is designed to fill this niche. ... "The Wellbeing of Australians - Impact of the Impending Iraq War" ...acqol.deakin.edu.au/index_wellbeing/index.htm - 17k -
Cached - Similar pages

Nice, very nice!

Monday, July 17, 2006

Maths and Science Education Initiatives

  • Maths and Science education initiatives are very necessary in the South African context. But it is also important to ensure that they deliver the goods at the end of the day. Different approaches have been tried to assist with the state of South African learners’ maths and science skills. The type of initiatives that we came across in our previous evaluations included:
    *Maths and Science Saturday schools that aimed to compensate for poor classroom based teaching and learning and giving the learners another shot at achieving the maths and science outcomes at preprimary and secondary phase.
    *Maths and Science Saturday or Holiday schools that aimed to prepare learners adequately for the Senior Certificate Examination
    *Upgrading of teacher qualifications through giving maths and science teachers the opportunity to gain full tertiary qualifications in maths or science
    *Afternoon workshops where skilled maths or science teachers did demonstration lessons with other maths and science educators to convey some lesson presentation ideas.
    *Building and equipping science labs to give learners the opportunity to engage fully with the Maths and science curriculum.
    *Commercially run science and maths exhibit centres that host interactive displays to demonstrate mathematical / scientific principles.
    *Science and maths fares, expos and exhibits.
    *Intensive Post matric course / bridging courses that focus heavily on science and maths tuition in order to help learners gain access to tertiary courses such as engineering.
    *Computer based science and maths learning using age appropriate software in computer laboratories.

    The lessons learnt were multiple and ad hoc, some of which I have taken the time to summarise below:
    · Once off workshops cannot do much to solve pervasive problems. Workshops should happen regularly and make space for the beneficiary teachers or learners to input into the content of the workshops.
    · Workshops where participants are not required to do anything more than attend, are unlikely to motivate beneficiaries to really participate and learn.
    · If the learning material is made available for further use in the classroom or with other colleagues at the school, it is likely to have an impact beyond the one learning encounter
    · Providing a solution (e.g. computer lab or teacher training programme) without the necessary support and maintenance will quickly negate the initial investment and reduce the impact
    · A multidimensional approach combining different strategies are imperative for success
    · Good programme management capacity is imperative, and should also include a mechanism to control for quality of content.
    · Programmes that collect basic monitoring data (number of beneficiaries, number of activities offered, cost per beneficiary per day) were more likely to be well run, and were also more likely to be very cost efficient.
    · There is limited cooperation between different agencies approaching the same problem and over reliance on a specific methodology- Once an agency has a hammer that makes some hits, they tend to want to fix all problems with this tool.

    Some documents that I found useful include:

    * David H. Greenberg, Charles Michalopoulos, Philip K. Robins : A Meta-Analysis of Government Sponsored Training Programs. www.mdrc.org/publications/264/full.pdf
    * HSRC. Trends in International Maths and Science Study results for South Africa http://www.hsrc.ac.za/research/programmes/ESSD/timss2003/mediaRelease.pdf *Coalition for Evidence-Based Policy : How to Solicit Rigorous Evaluations of Mathematics and Science Partnerships (MSP) Projects - A User-Friendly Guide for MSP State Coordinators. Available online at: http://www.ed.gov/programs/mathsci/issuebrief.doc

* Coalition for Evidence-Based Policy : How to Conduct Rigorous Evaluations of Mathematics and Science Partnerships (MSP) Projects - A User-Friendly Guide for MSP Project Officials and Evaluators. Available online at: http://www.ed.gov/programs/mathsci/mspbrief2.doc

Thursday, July 13, 2006

Cute Web Resource on Logic Models

We often have to do training on Logic models and assist our clients in developing indicator frameworks. There are various resources on the net available to help you do this, but in the end we usually have to facilitate a workshop with the clients.

Before I can send a consultant out to do some training for us, I have to make sure that they understand the concepts exactly as we do. I have found a cute resource that might show the way on how we can start to streamline our knowledge management processes. Instead of sitting with a consultant everytime before an assignment, we could start using technology to make the job easier. Videotaping a training session is one way of doing it, but at the following link you will find a particularly cute example of how one could use flash to create a website / CD. I think this is an excellent resource!

http://www.usablellc.net/Logic%20Model%20(Online)/Presentation_Files/index.html

Also, some discussion on the AEA list recently pointed to the following basic guides about evaluation.
http://gsociology.icaap.org/methods/basicguides.html

Wednesday, June 28, 2006

Logistic Regression & Odds Ratios

We seldom or ever get to use inferential statistics when we do M&E. I think that there might actually be room for including some of these statistics in our evaluations. Here is an example of how logistic regression was used to inform a VCT centre's marketing campaign:

We used logistic regression to determine which sets of factors associate significantly with a person's propensity to go for an HIV test. The survey covered various knowledge questions (e.g. can HIV be transfered via a toothbrush?), biographical information (how old are you, are you married?) and a variety of risk factors (did you use a condom last time you had intercourse, have you had more than one sexual partner over the past year). The intention was to find out who to market VCT services to. For example, if we found that men who had multiple partners and are younger than 25 and have at least matric are more likely to test than those who are older than 25 or do not have matric, then there is a whole marketing campaign right there!

The logistic regression yields an odds ratio and an adjusted mean.

An odds ratio indicates the likelihood that a specific indicator or scale is associated with a behaviour occurring or not occurring. If the odds ratio is larger than 1, then it indicates that it is likely that the indicator is associated with the occurrence of the outcome variable. If the odds ratio is smaller than 1, then it indicates that is likely that the indicator will be associated with the non-occurrence of the outcome variable.

For example, if we are checking whether having tested previously would co-occur with the intention to test in future, we may get the following results.
Unadjusted Means for
Intention to test
No Yes Odds Ratio
Person tested previously 0.28 0.58 3.51
Because the odds ratio is positive, we can conclude that people that tested previously are about 3 times more likely to intend to test in future. The unadjusted means confirm this: If a person is likely to test (he / she falls in the Yes category) he or she “scores” 0.58 out of 1 (Where 1 indicates that the person did test previously) while a person that is not likely to test (he / she falls in the No category) only “scores” 0.28 out of 1.

Monday, June 26, 2006

Notes to Self

As a member of the AEA, I subscribe to their EVALTalk listserv (Archives at http://bama.ua.edu/archives/evaltalk.html). These are some of the useful things they mentioned over the past week, that I should investigate a bit more because it might be of relevance to my work: *****************************************
*When you have quant data, you often use tables and graphs for representing your data.
*Apparently "The Visual Display of Quantitative Information" by Edward Tufte is a really good resource. It can be ordered for around $40 from the website: htttp://www.edwardtufte.com/tufte/

*"Visualizing Data" by William Cleveland is said to be another good source.
*And then there is: Trout in the Milk and Other Visual Adventures by Howard Wainer. Here is an indication of the type of things he has to say:
http://www-personal.engin.umich.edu/~jpboyd/sciviz_1_graphbadly.pdf


*****************************************
*Rasch Analysis might be useful to use when analyzing test scores.
From http://www.rasch-analysis.com/using-rasch-analysis.htm
a Rasch analysis should be undertaken by any researcher who wishes to use the total score on a test or questionnaire to summarize each person. There is an important contrast here between the Rasch model and Traditional or Classical Test Theory, which also uses the total score to characterize each person. In Traditional Test Theory the total score is simply asserted as the relevant statistic; in the Rasch model, it follows mathematically from the requirement of invariance of comparisons among persons and items.
A Rasch analysis provides evidence of anomalies with respect to
the operation of any particular item which may over or under discriminate
two or more groups in which any item might show differential item functioning (DIF) anomalies with respect to the ordering of the categories. If the anomalies do not threaten the validity of the Rasch model or the measurement of the construct, then people can be located on the same linear scale as the items the locations of the items on the continuum permits a better understanding of the variable at different parts of the scale locating persons on the same scale provides a better understanding of the performance of persons in relation to the items. The aim of a Rasch analysis is analogous to helping construct a ruler, but with the data of a test or questionnaire.

More info at:
http://www.rasch.org/rmt/rmt94k.htm
http://www.winsteps.com/
*****************************************
* When we compare pre- and post scores, we usually make the faulty assumption that the gain is measured on a unidimensional scale with equal intervals. In fact, you have to normalise your scores first. A gain from 45 to 50% (5 points) is not the same as a gain from 95 to 100% (also five points) The following formula can be used: g = [{%post} – {%pre}] / [100% - {%pre}]
Where:
The brackets {. . .} indicate individuals averages,
g is the actual(normalized)average gain


So if a person improved from 45% to 50% his gain would be:

{g} = (50 – 45)/ (100 – 45) = 5/55 = 0.091 (On a scale from 0 to 1).
This means the person learnt 9.1% of what he didn’t know on the pre-assessment by the time he was assessed again.

If a person improved from 95% to 100% his gain would be:

{g} = (100 – 95) / (100 – 95) = 5/5 = 1 (On a scale from 0 to 1). This means the person learnt 100% of what he didn’t know on the pre-assessment by the time he was assessed again. (The graph at the bottom demonstrates the logistic curve of this formula)

This formula should only be used if:
(a) the test is valid and consistently reliable;
(b) the correlation of {g} with {%pre} (for analysis of many courses), or of single student g with single student %pre (for analysis of a single course), is relatively low; and
(c) the test is such that its maximum score imposes a performance ceiling effect (PCE) rather than an instrumental ceiling effect (ICE).

Monday, June 19, 2006

The Gaps in Evaluation

Just last week I was lamenting the fact that we get so few opportunities to conduct proper impact evaluations in the work that we do. Especially if it comes to training initiatives.

If we use the language of the Kirkpatrick model (which has been criticised a lot, I know, but its useful for this discussion), we often end up doing evaluations at Level 1 (Reaction and Satisfaction of the training participants) Level 2 (Knowledge evaluation) and if we are really lucky Level 3 (behaviour change). Seldom, if ever, do we get an opportunity to assess the Level 4 results (organisational impact) of initiatives.

One of our clients are training maths teachers in a pilot project that they hope to roll out to more teachers. In this evaluation we have the opportunity to assess teachers' opinions about the training (through focused interviews with selected teachers), their knowledge after the training (through the examinations and assignments they have to complete) as well as their implementation of the training in the class(through a classroom observation). We will even go as far as to try to get a sense of the organisational impact (by assessing learners). The design includes a control group and experimental group ala Cook and Campbell quasi experimental design guidelines. The problem, however, is that we had to cut the number of people involved in the control group evaluation activities and we had to make use of the staff from the implementing agencies to collect some data. Otherwise the evaluation would have ended up costing more than the training programme for another ten teachers.

In another programme evaluation, our client wants to evaluate whether their training impacts positively on small businesses' turnover and their own company's (a company that markets their products through these small businesses) bottom line. Luckily they have information on who attended the training, how much they ordered before the training and how much they ordered after the training. It is also possible to triangulate this with information they collected about the small businesses during and after the training workshop. This data has been sitting around and it is doubtfull that any impact beyond the financial impacts will be of interest to anyone.

Although both of these evaluations were designed to deliver some sort of information about the "impacts" they deliver, they still do not measure the social impact of these initiatives properly. A report from the "Evaluation Gap Working Group" raises this question and suggests a couple of strategies that could be followed in order to find out what we do not know about the social intervention programmes we implement and evaluate annually.

I suggest you have a look at the document and think a bit about how it could impact the work you do in terms of evaluations.

Ciao!

B

* For information about the Kirkpatrick Model, please read this article from the journal: Evaluation and Programme Planning at www.ucsf.edu/aetcnec/evaluation/bates_kirkp_critique.pdf or the following article that is reproduced from the 1994 Annual: Developing Human Resources. http://hale.pepperdine.edu/~cscunha/Pages/KIRK.HTM

* Cook, T.D., and Campbell, D.T. (1979). Quasi-experimentation: Design and analysis issues for field settings. Rand McNally . This is one of the seminal texts about quasi experimental research designs.
Bill Shadish reworked this text and released it in 2002 again. Shadish, W.R. , Cook, T.D., & Campbell, D.T. (2002). Experimental and Quasi-Experimental Designs for Generalized Causal Inference by

* The following post came through the SAMEA listserv and raises some interesting questions about evaluations.

When Will We Ever Learn? Improving Lives Through Impact Evaluation
05/31/2006

Visit the website at
http://www.cgdev.org/section/initiatives/_active/evalgap
Download the Report in PDF format at
http://www.cgdev.org/files/7973_file_WillWeEverLearn.pdf (536KB)

Each year billions of dollars are spent on thousands of programs to improve health, education and other social sector outcomes in the developing world. But very few programs benefit from studies that could determine whether or not they actually made a difference. This absence of evidence is an urgent problem: it not only wastes money but denies poor people crucial support to improve their lives.

This report by the Evaluation Gap Working Group provides a strategic solution to this problem addressing this gap, and systematically building evidence about what works in social development, proving it is possible to improve the effectiveness of domestic spending and development assistance by bringing vital knowledge into the service of policymaking and program design.

Tuesday, June 13, 2006

Q&A: What size should my Sample Be?

Last night I thought of something besides musings that I could post on this blog. Given that I hope this blog will be useful to someone, somewhere, I thought of posting some of the questions and answers colleagues send to me when they need a sounding board. The question I received below is from a friend in one of the Southern African Countries. I attach both the question and the answer for your review. If you have anything to add, please leave a comment.

________________________________________________

Dear B,

Please let me know if what I am asking you is disturbing your busy days and whether I should be paying for the services you are providing me with! I feel bad bothering you incessantly like this however I also feel that in many ways you are the best placed to provide advice with some of the things I am facing here...

Currently, I am preparing for a post-assistance evaluation household exercise to check how the households are using the assistance we are providing them with. Originally we are to do this survey between 4-6 weeks after assistance to see how they used it, what they thought of it, etc. etc. As you will see from the attachment, some of the activities took place a while ago and the survey was not done. In total, we have to create a sample out of 1700 families we have assisted across the various sites.

Everyone has their own opinion on how to sample within each site: just take 10, just take 20 households, count every 5 households and interview them, take a %age per site etc. I need to come up with the right size based on the numbers per site, the total number of households and keeping in mind that capacity is low given the number of sites and few numbers of field staff.

Another suggestion I had from a colleague who is more knowledgeable than most in the office about statistics is to decide on a fix number of households per site (e.g. 20) and decide that 5 must be female-headed, 5 male-headed, 5 child-headed (if exists etc.). Would this work or do we have to know the number of female, male, child-headed households per site?

I wanted to know if you had any suggestions as to how best collect a good sampling size and way of sampling as well. Do you have any suggestions?

Again, please feel free to let me know if you can't assist

___________________________________

Hi D

It is always nice to hear from you. You have such interesting challenges to deal with and it generally doesn’t take very long to sort it out. Plus it gives me an opportunity to think a bit about things other than the ones I am working on. So please don’t feel bad when you send me questions. If I’m really really busy it will take a couple of days to get back to you – that’s all. PS. The sample size question is the one I get asked most frequently by other friends and colleagues.

A good overview of the types of probability and non-probability samples are available here - http://www.socialresearchmethods.net/kb/sampling.htm . Note that if you are at all able to, it is always better to use a probability sample. The usual way in which household surveys are done is some form of simple random selection, or clustered sample. In other words – A simple random sample means you take a list of all the households, number them and then, using a table of random numbers, select households until you get to the predetermined amount of households. People often think that random selection and selecting “at random” is the same thing, which it obviously isn’t. For clustered samples you may use neighborhoods as your clusters. So if your 1200households are spread across 10 neighborhoods, you may randomly select 3 or 4 neighborhoods and then within each neighborhood, you randomly select households.


In many instances you don’t have a list of all the households so it makes random selection a bit difficult. Then it is good to use a purposive sample or quota sample or some combination of samples. For a household survey on Voluntary Counseling and Testing I did with Peter Fridjhon at Khulisa they used grids which they placed over a map of the area and then selected grid blocks, then streets and then households. This is also a common methodology used for the household surveys conducted by Stats SA. I attach another document with some information about how they went about to draw the sample. My guess is that this approach (or something like it) is the one you would use.

Remember that when “households” are your unit of analysis, you should have strict rules about who will be interviewed. I.e. ask for the head of the household, if he/she is not there, then ask for the person that assumes the role of the head in his/hear absence. Children under age 6 may not be interviewed. If there is no-one to interview then the household should be replaced in some random manner. (It’s always a good idea to have a list with a number of replacement sites available during the fieldwork if this happens.

In terms of sample size – it is a bit of a tricky one especially if you don’t have the resources. It is important to remember that your sample size is only one of the factors that influences the generalisability of your findings. The type of sample you draw (probability or non-probability) is almost as important. I attach a document I wrote for one of my clients to try to explain some of the issues. It also says a little bit about how your results should be weigthed in order to compensate for the fact that a person in a household with 20 members have a 1/20 chance to be selected while a person in a household with 2 members have a ½ chance to be selected.

Back to the sample size issue though – I always use an online calculator to determine what the sample size should be for the findings to be statistically representative. This one http://www.surveysystem.com/sscalc.htm is quite nice because it has hyperlinks that link to explanations of some of the concepts. Remember that if you have sub groups within your total population that you would like to compare, it is important to know that your sample size will increase quite significantly. (The subgroup will then be your population for the calculation)

I would do the following: Check with the calculator how many households you should interview, then use a grid methodology to select the households. If you cannot afford to select as many cases as the sample calculator suggests, then just check what your likely sampling error will be if you select fewer cases.

I don’t know if this made any sense, but if not, give me a shout and I’ll try to explain more.

Keep well in the mean time.

Regards
------------------------------------
Attachment one: Sampling Concepts

The following issues impact how the performance measures are calculated and interpreted.

What is a sample?
When social scientists attempt to measure a characteristic of a group of people, they seldom have the opportunity to measure that characteristic in every member of the group. Instead they measure that characteristic (or parameter as it is sometimes referred to) in some members of the group that are considered representative of the group as a whole. They then generalise the results found in this smaller group to the larger group. In social research the large group is known as the population and the smaller group representing the population is known as the sample.


For example, if a researcher wants to determine the percentage children of school going age that attend school (the nett enrolment rate), she/he does not set out to ask every South African child of school going age if they are in school. Instead she/he selects a representative group and poses the question to them. She then takes those results and assumes that they reflect the results for all learners of school going age in South Africa. The population is all South African learners of school going age the sample consists of the group she selected to represent that population.


What is a good sample?
A good sample accurately reflects the diversity of the population it represents. No population is homogenous. In other words, no population consists of individuals that are exactly alike. In our example - the population of South African children of school going age - we have people of different genders, population groups, levels of affluence, and of course, school attendance, to name just a few variables. A good sample will reflect this diversity. Why is this important?


Let’s consider our example once again. If the researcher attempts to determine which percentage of South African children of school going age attend school, and selects a sample of individuals living in and around Pretoria and Johannesburg, can the findings be generalised with confidence? Probably not. It is reasonable to assume that the net enrolment rate may differ substantially between urban areas and rural areas. Specifically, you are more likely to find a greater net enrolment rate in urban areas. So in this case the sample results would not be an accurate measure of the levels of education for the population.


Sampling error
The preceding example illustrates the biggest challenge inherent in sampling – limiting sampling error. What is meant by the term sampling error? Simply this: because you are not measuring every member of a population, your results will only ever be approximately correct. Whenever a sample is used there will always be some degree of error in results. This “degree of error” is known as sampling error.
Usually the two sampling principles most relevant to ensuring representativity of a sample, and limiting sampling error, are sample size and random selection.

Random selection and variants
When every member of a population has an equal chance of being selected for a sample we say the selection process is random. By selecting members of a population at random for inclusion in a sample, all potentially confounding variables (i.e. variables that may lead to systematic errors in results) should be accounted for. In reference to our example – if the researcher were to select a random sample of children of school going age, then the proportion of urban vs. rural individuals in the sample should reflect the proportion of urban vs. rural individuals in the population. Consequently any differences in net enrolment rates for urban and rural areas are accounted for and any potential error is eliminated.


Unfortunately random selection is not always possible, and occasionally not desirable. When this is the case, researchers selecting a sample attempt to deliberately account for all the potential confounding variables. In our example the researcher will try to ensure that important population differences in gender, population group, affluence etc. are proportionately reflected in the sample. Instead of relying on random selection to eliminate potential error, she/he does so through more deliberate efforts.

Sample size
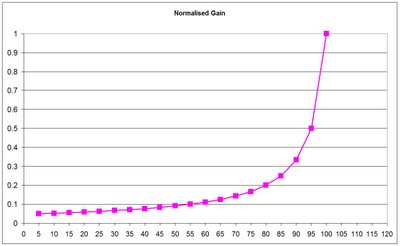
In terms of sample size, it is generally assumed that the larger the sample size, the smaller the sampling error. Note that this relationship is not linear. The graph below illustrates how the sampling error decreases as sample size increases. The graph illustrates the relationship between sample size and sampling error as a statistical principle. In other words the relationship shown here is applicable to all surveys, not just the General Household Survey.


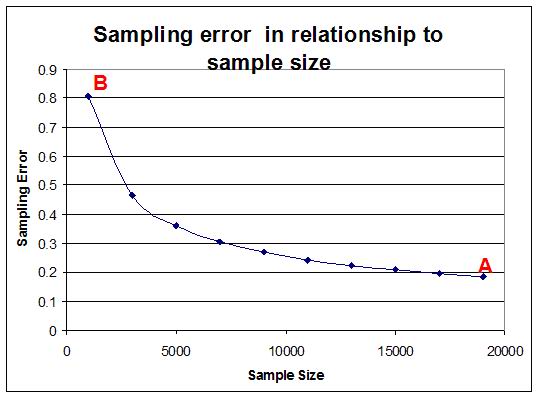
In the General Household Survey, the sample included 18,657 children of school going age for the whole of South Africa. This sample was intended to represent approximately 8,242,044 children of school going age in the total South African population. Because it is a sample there will be some degree of error in the results. However the sampling error in this case approaches a very respectable 0.2% (See point A in the graph above) because of the large sample size.


What does this mean? Well, if we are reporting values for a parameter - e.g. the number of children that are in school - and find that the result for the sample is 97.5%, it means that the same parameter in the population – the number of children that are in school - will range between 97.3% (97.5%-0.2%) and 97.7% (97.5%+0.2%). Note that if the sample included only 1000 people that the sampling error would have increased to 0.8%.

Statistical significance
It is not always correct to manually compare averages and percentages when one is interested in differences between different years’ or different provinces’ results. Percentages and averages are single figures that do not always adequately describe the variance on a specific variable. One needs to be convinced that a “statistically significant” difference is observed between two values before one can say one value is “better” or “poorer” than the other.


In order to make confident statements of comparison about averages, one would need to conduct tests of statistical significance (e.g. a t-test) using an applicable software package. These tests take into account the variance attributable to the sampling error and the normal variance around a mean. A person with some skills in statistical analysis could produce results (In a statistical analysis package or even in a spreadsheet application such as excel) that will allow adequate comparison of means between and within groups.


Weighting
Earlier we mentioned that one of the properties that influence representivity of sample results is whether the people all have the same probability of selection. If one had a complete list of all people in South Africa and a specific address for each one of them, you could have randomly selected people from this list and visited each one of them at their address. In this scenario each person has an equal chance to be included in the sample because you have the relevant details about them.

Unfortunately, researchers rarely have this kind of list and the costs would be very high if you had to visit each of the people you selected at their own address – You would probably end up speaking to one person per address only. To save time and money researchers rather speak to all people in a specific household that they select, but then all of the individuals in the population no longer have the same likelihood to be selected because this is impacted by which households are selected.

The probability of selection is even further complicated if one considers that researcher also don’t have a list with all households in South Africa to randomly select from. To get around this problem they use information about neighbourhoods and geographic locations to identify areas in which they will select households. When a survey uses neighbourhoods or households as a sampling unit, there is little control over the number of persons that will be included in the survey. One household in area A could have 5 people in it and the household next door might have 3 people in it. In order to ensure that the individuals within households (and households within neighbourhoods or household sampling units) are not disproportionately represented in relationship to known population parameters, weighting is applied.

Different weighting procedures can be used to correct for the probability of selection. The weighting procedure is usually selected by statisticians involved with the sampling in the survey. The weight to apply to each individual is usually captured as a variable somewhere in the dataset. Although it is beyond the scope of this manual to explain different ways of weighting it is important to consider that weighting will affect the percentages and absolute numbers produced.

The following table indicates how the percentage of 7 – 14 year olds that indicate they attend school in the General Household Survey differ when weighting is applied and when it is not applied.

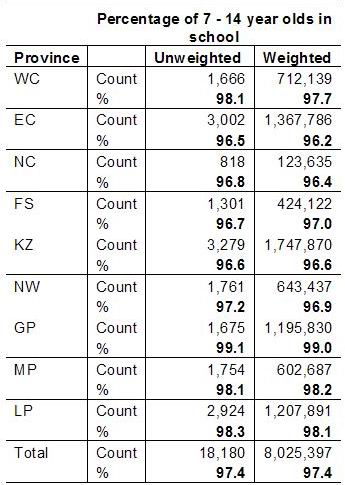
When analysing the data, it is important to ensure that the weighting is taken into account – both when percentages, averages and absolute numbers are computed. It is necessary to use a statistical analysis programme such as SPSS™ or STATA™ to produce any results.


------------------------------------
Attachment two: Household Survey Sampling Approaches

(This was produced by Khulisa Management Services)

For each of the three cities, Khulisa first conducted a purposive geographic sample, to be in alignment with the racial population and Living Standard Measure (LSM) levels three to seven[1] of the geographic area. LSM is used as an indicator of the principle index of the South African consumer market. It was first developed in 1991 by the South African Advertising Research Foundation (SAARF).

For each racial cell in the sampling framework above, the following methodology was used. Four by four, uniform grids were placed over the selected geographic areas. Cells from these grids were randomly selected and a subsequent ten by ten grid placed over the selected cell. A cell from the ten by ten grid was randomly selected after which a street block was selected. A street intersection was noted, and a house was randomly selected (left-side and out of ten houses on the block). The street intersection was the starting point as you move down the street/block. The primary sampling site was located on the left side of the street, with the alternative site being located on the right side of the street. The location of the two primary houses and two replacement houses was given to each fieldworker. This equated to 1200 sample sites and 1200 replacement sites picked from 600 street blocks. This strategy ensured that two fieldworkers – male and female – can work in the same street thus improving the safety levels of the fieldworkers, especially the females.

In an area with apartment buildings (like Joubert Park), after picking the apartment building the fieldworkers were instructed to select the second floor and the number indicated on the instructions for the flat to carry out the interviews.

If there was no house or flat in the pre-selected location, then it was recorded as an Unfeasible Site on the Fieldworkers’ Instrument Control Sheet. Similarly, if there were no eligible respondents in the household, then that was recorded as ALL Ineligible Respondents on the control sheet.

[1] The SABC ConsumerScope (2003) characterizes LSM levels three through seven by the following average monthly household income levels: Level 3: R1104; Level 4: R1534; Level 5: R2195; Level 6: R3575 and Level 7: R5504.

Monday, June 12, 2006

Pet Peeves: Kakiebos & Cosmos

I have been doing M&E for about five years or so. In this time, I have come to develop a list of "Pet Peeves" which I will refer to as the "Kakiebos & Cosmos" list for the purposes of this blog. I am sure that I am not the only person that experience these. And I am sure many of these peeves are not unique to the M&E field. In fact, I would venture to say that these things are probably as common as kakiebos(1) or cosmos(2).

Here is my list:

* "Door stop" evaluations. In other words people commision evaluations that lead to reports that are ever only used as door stops, and nothing else.

* "Lottery" evaluations. These are the kind of evaluations where the client gives you (and 25 other service providers) no more than half a page background about the project and expects you to come up with a 25 page proposal that details exactly what needs to be done... Without any indication of what the budget should be... Its like playing the lottery where you have a one in twenty five chance to actually win the assignment.

*"SCiI Evaluations" These are the evaluations where "Scope Creep is Inevitable" and you end up writing the client's evaluation report, annual report, management presentation and also plan next year's evaluation.

*"PR Evaluations" You are engaged to do an evaluation. So you tell the story about the Good, the Bad and the Ugly Fairy Godmother's role in all of it. When you submit the first draft of your report, your client complains that it "Isn't what we envisioned". The euphemism for "What in the world are you thinking? We can't tell people we did not make any impact! Rewrite the report and change all of the findings so that we can impress the boss / shareholders / board / funder!!!"

* "Pandora's Box" evaluations. This is the kind of evaluation your clients let you do while they know there are a myriad of other unrelated issues that will make your job close to impossible. These evaluations tend to happen in the middle of organisational restructuring / just before the boss is suspended for embezzling funds / whilst a forensic audit is happening and everyone is in "hiding" / a year after the online database was started without any training for the users

* "Tell me the pretty story" evaluations. These are the kinds of evaluations where you are expected to produce a pretty report full of pictures with smiling faces and heart-rendering stories, without a single statistic that helps the reader to grasp what the costs or benefits of the project / programme was.

Like kakiebos, these types of evaluations are abundant. And not very useful. Sometimes, these evaluations even resemble cosmos. Still thoroughly useless but at least very pretty to look at for short periods of time. In fact, like kakiebos and cosmos, these evaluations just tap resources that should have been available for doing useful things, like growing sunflowers.

Oh, I don't know. Maybe people that commission / do kakiebos & cosmos evaluations should be sentenced to 100 hours of community service? I think gardening might be a good punishment for them. What do you say?

(1) Kakiebos is the Afrikaans vernacular for the plant Tagetes minuta which is commonly found on disturbed earth e.g. next to roads and is commonly regarded as a weed.
(2) Cosmos is the vernacular for the plant Bidens spp. which is commonly found on disturbed earth e.g. next to roads and is commonly regarded as a weed. In March / April it is, however, quite a spectacular sight to see as these plants carry white, pink and purple flowers.

What this is all about

I am a partner with Feedback Research & Analytics - a South African consultancy that focuses, amongst other things, on conducting monitoring and evaluation (M&E) across various sectors for private companies, NGOs and Civil Society Organisations as well as government departments.

(If you are interested in finding out what the "other things" are that we also do, please visit our website www.feedbackpm.com).

I intend for this blog to become home to some musings about M&E, the challenges that I face as an evaluator and the work that I do in the field of M&E.

If you have anything interesting to add or if you are interested in becoming a contributor to this blog, leave a comment and I'll get back to you.

Ciao

BvW